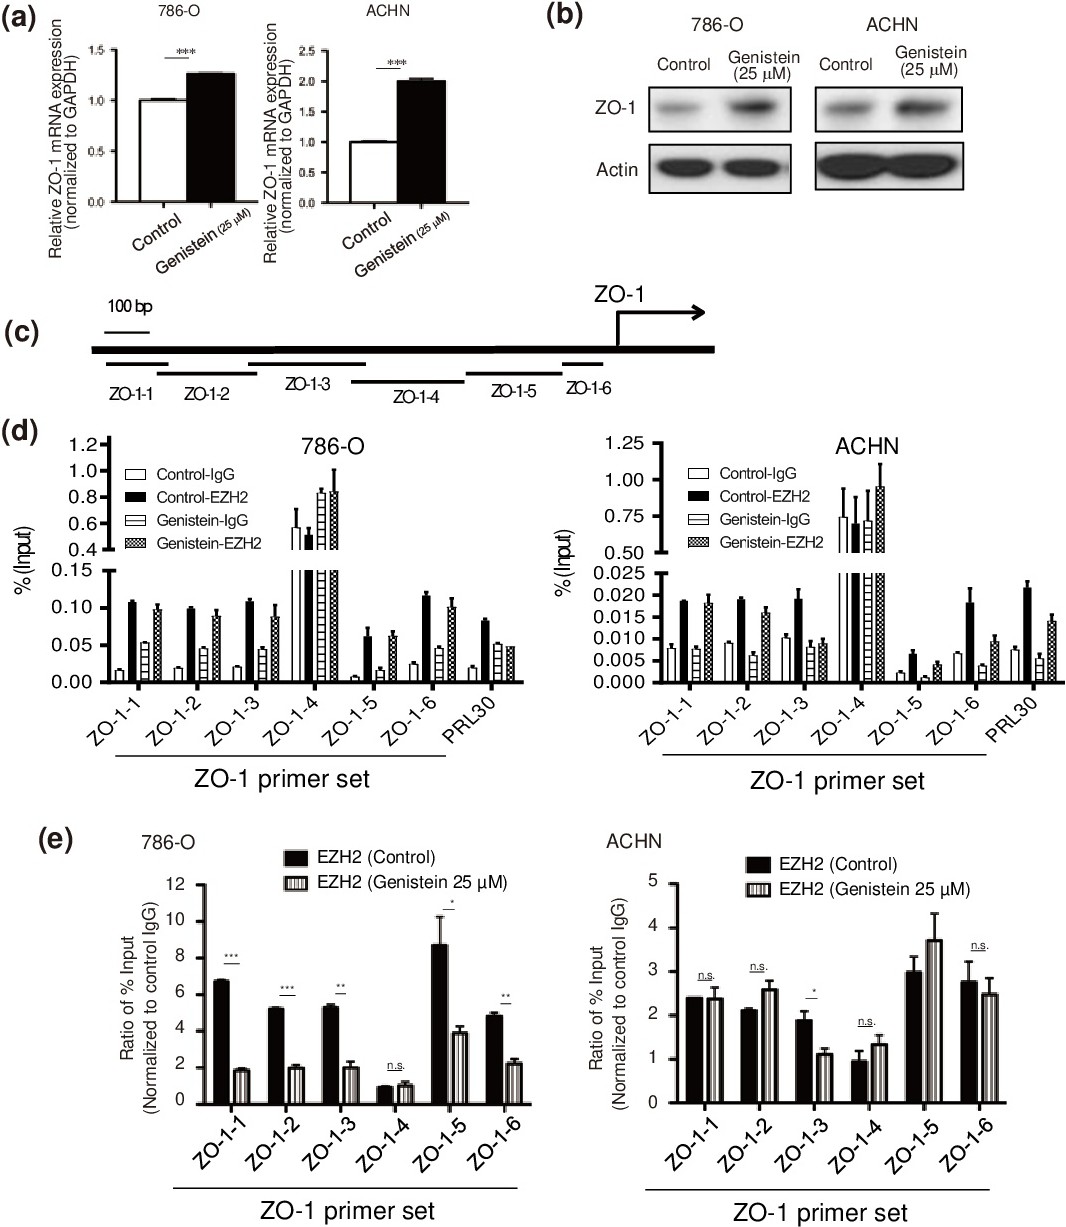
Fig. 2. Genistein suppresses EZH2 recruitment to the ZO-1 promoter region. (a) 786-O and ACHN cells were treated with genistein (25 μM) or control (DMSO) for 96 hours. Then, quantitative RT-PCR was performed for ZO-1. (b) Expression of ZO-1 protein was analyzed by Western blot in 786-O and ACHN cells treated with genistein (25 μM) or control (DMSO) for 96 hours. (c) Schematic representation of the promoter region of the human ZO-1 gene and primer set location. Primer sequences are listed in Table 1. (d) ChIP-quantitative RT-PCR analyses of EZH2 binding at selected multiple ZO-1 promoter targets with and without genistein. The ribosomal protein L30 (RPL30) was used as a positive control to validate ChIP assay. Y axis shows percent of input recovery. (e) Relative change of EZH2 at elected multiple ZO-1 promoter targets after genistein (25 μM) treatment for 96 hours. Y axis shows the ratio of percentage of input normalized to control IgG. Expression levels are normalized to GAPDH and those in control-treated cells were defined as 1. *p<0.05, **p<0.01, ***p<0.001, 'n.s.' p>0.05.